Debugging
Emulator Window
You can debug your bot conversation by using the built-in Emulator Window. The emulator is meant for developers to debug the conversations and is not meant to replicate what the end-users will see visually (i.e. some messages will not render properly). To visualize the full user experience, you should use the Web Channel directly.
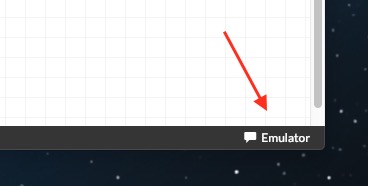
To open the Emulator, you can:
- Press e anywhere in the application
- Click the Emulator icon in the status bar
You can close the Emulator by pressing ESC or by clicking again on the emulator icon.
Resending the same messages
Using ↑ or ↓ on your keyboard in the text input will allow you to quickly navigate and re-send previously sent messages. The last 20 messages sent to this bot are persisted in your browser storage.
Payload Inspector
The payload inspector lets you see and understand what the bot understood and why it took the decision he chose. Inside the emulator, you will see the metadata about NLU, the conversation State and the raw responses.

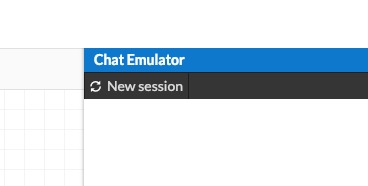
Sessions
All the messages you send using the Emulator will come from the same user from the bot's perspective.
To start a conversation from scratch, you can press the "New Session" button in the toolbar of the Emulator window. Doing this will generate a new user, so all previously set variables and state will be forgotten by the bot.